State Policy Update: New Middle-Skill Job Fact Sheets; NGA Awards Funding to 14 States

August 29th, 2014

Across the country, employers are struggling to find qualified workers to fill critical middle-skill jobs. These positions, which require some postsecondary education but not a bachelor’s degree, constitute the majority of the U.S. labor market, but new analysis from the National Skills Coalition (NSC) indicates that there aren’t nearly enough qualified American workers to fill middle-skill openings, hampering states’ economies from growing and employers from hiring.

Earlier this week, NSC released a set of 50-state fact sheets that examines these forgotten middle-skill jobs. Analyzing data from the Bureau of Labor Statistics and the American Community Survey, NSC found that middle-skill jobs account for 54 percent of the U.S. labor market but only 44 percent of workers fit into the middle-skill cohort. Conversely, the analysis showed a large surplus of low-skilled workers competing for low-skilled jobs and a smaller, but similar, surplus for high-skill workers and jobs.

Career Technical Education helps to bridge these gaps in key industries. Students with a CTE-related associate’s degree or credential can earn up to $19,000 more per year than those with a comparable humanities degree.

 NGA Awards Funding to 14 States

The National Governors Association recently awarded grant funding to 14 states in an effort to help align education and training systems to the needs of the state economies.

As a postsecondary degree or certificate rapidly becomes the new minimum for citizens to gain access to the middle class and beyond, states are looking to maximize their role in promoting collaboration among state agencies, technical training and education institutions to ensure business and industry have the skilled workforce they need to succeed and grow.

With the grant money, states are intended to make progress in the following areas:

  • Articulate and implement a strong vision connecting the education and training systems with the needs of the economy;
  • Integrate and use education and workforce data to inform policy, track progress and measure success;
  • Build industry and education partnerships; and
  • Modify the use of resources and incentives to support attainment of the integrated vision.

Andrea Zimmermann, State Policy Associate 

CTE Research Review

August 27th, 2014

Research Image_6.2013As postsecondary institutions work to ease students through higher education with an increasing number of interventions such as statewide articulation agreements and common course numbering systems, students moving from one postsecondary institution to another still find that their earned credits often will not move with them.

Against the backdrop of increasingly complex transfer patterns, the National Center for Education Statistics has taken a closer look at a crucial piece of the transfer process – postsecondary credit transferability. This report focuses on transfers between postsecondary institutions not the high school-to-college credit transfer through dual enrollment and other agreements.

This new study examines how often, and under what conditions, students transfer from one postsecondary institution to another and how many of their earned credits will transfer with them. The study also considers to what degree institutional and student characteristics affect credit transfers. It should be noted that the study captures only first-time, full-time students.

Analyzing data from the 2009 Postsecondary Education Transcript Study, NCES found that 35 percent one-third of first-time beginning undergraduates transferred at least once in six years, and more than 10 percent of students transferred more than once.

The study found two factors consistently contributed to successful credit transfers – academic performance prior to transfer and the direction by which a student was transferring. Overall, when a student transfers in a way that the higher education system is designed to accommodate, a student’s credit was much more likely to transfer. More than half of transfer students started in community colleges, and were more likely to have successful credit transfers than “reverse or horizontal transfers,” when students move from a university to a community college or between institutions of the same type.

Be sure to check out the full 60-page report to take a closer look at the student transfer experience.

Andrea Zimmermann, State Policy Associate

CTE Research Review

August 20th, 2014

Research Image_6.2013The 46th annual “2014 PDK/Gallup Poll of the Public’s Attitudes toward the Public Schools” is being released in two parts this year, with part one debuting Wednesday. The findings present a complicated picture of public attitudes toward the Common Core State Standards (CCSS), standardized tests and issues surrounding local control. This year’s topics were selected by an expert panel that included NASDCTEc member Katherine Oliver, Assistant State Superintendent at the Maryland Department of Education.

Making headlines were results indicating that support for CCSS is fading fast. This may be tied to misunderstanding of its purpose, as the study found that most Americans oppose public education efforts that they believe were created or promoted by the federal government and strongly support local control of what schools teach. While CCSS is neither a federal initiative nor designed to mandate specific curricula, the poll indicates that many Americans see CCSS as an example of federal overreach. According to the poll 56 percent say local school boards should have the greatest influence in deciding what is taught in public schools. Almost 30 percent of respondents indicated that state governments should have the greatest influence on what public schools teach.

Persistent across age, income and education levels, a majority of Americans also oppose using the CCSS to guide instruction, though opinion splits by political affiliation — Republican (76 percent), Independents (60 percent) and Democrats (38 percent). Nationally, just one in three people said they favored the standards, primarily because they will help students learn what they need to know regardless of where they go to school.

Each year, the study asks the public to grade the President’s performance in support of public schools. This year, President Barack Obama received the lowest grade since becoming president in 2009. Underscoring the deep divides over education in the country, respondents equally gave the President an A or B (27 percent) or a Fail (27 percent).

The study’s co-author and CEO of PDK International, William J. Bushaw, said policy makers are often faced with a tough reality when public opinion and public policy conflict, with the question being whether to modify the policy to align with public opinion or launch a communications campaign to better explain the new policy.

“To address higher achievement and greater equity, the United States needs standards of excellence, and there is wide agreement that the Common Core State Standards offer these standards. In this case, modifying policy is not a solution,” Bushaw wrote. “… Working together, education professionals through their associations, along with business and political leaders can work together to mount a nonpartisan communications campaign explaining to Americans why the Common Core State Standards are essential to the nation’s future and to the success of all children. Public support for the standards is declining — we need to fight for these standards since we are losing in the court of public opinion.”

Check back on September 17 for the second part of the 2014 poll with topics such as preparing students for college and careers, importance and affordability of college, preparing and evaluating teachers, support for reforming America’s schools, and student well-being.

Andrea Zimmermann, State Policy Associate

CTE Research Review

August 14th, 2014

Research Image_6.2013Although apprenticeships make up just 0.2 percent of the U.S. labor force, they are garnering more attention this summer thanks to recent reports, including from the White House’s Ready to Work initiative and a set of policy recommendations from The Brookings Institution’s Hamilton Project.

American University economics professor Robert I. Lerman posited that investing, expanding and re-branding U.S. apprenticeships has “the potential to reduce youth unemployment, improve the transition from school to career, upgrade skills, raise wages of young adults, strengthen a young worker’s identity, increase U.S. productivity, achieve positive returns for employers and workers and use limited federal resources more effectively.”

Despite such findings, the size of the U.S. apprenticeship system stands in stark contrast to other major developed countries such as Canada (2.2 percent), Britain (2.7 percent) and Australia and Germany (both 3.7 percent). In Britain, apprenticeships are coming back into favor after years of decline, much like the United States’ system. Recent surveys show that students and the wider public have a “growing appetite” for apprenticeships.

Federal investments would be one part of the approach to expanding the U.S. apprenticeship program. According to Lerman, the United States spends less than $30 million annually, whereas Britain spends about £1 billion (or $1.7 billion). If British spending on apprenticeships were adjusted to match the U.S. population, Lerman estimates that figure would be $8.5 billion.

Calling the expansion of apprenticeships a “potential game-changer”, Lerman offers recommendations for federal and state governments as well as examples of successful youth apprenticeship programs in Georgia and Wisconsin

Be sure to check out additional apprenticeship-related recommendations from the Center for American Progress, through their series of issue papers as well.

Andrea Zimmermann, State Policy Associate

CTE Research Review

August 7th, 2014

Research Image_6.2013Research has shown time and again that finishing what you start in higher education is key to higher lifetime potential earnings, gainful employment and much more. Most researchers use the term, “some college” for students who enrolled in college but left without receiving a degree or certificate, but what does this enigmatic term really mean?

Though this category includes 31 million students over the past 20 years, little is known about the students themselves. The National Student Clearinghouse (NSC) takes a closer look at who makes up this group with its new report, “Some College, No Degree: A National View of Students with Some College Enrollment, but No Completion”.

Through national data on enrollments over time and across institutions, NSC was able to dig deeper than most reports, which traditionally survey a representative sample of adults. By using data, NSC excluded those who earned degrees or certificates and analyzed the enrollment pathways of the “some college” population.

In particular, the report focuses largely on two groups of students: those who had enrolled in multiple institutions, and “potential completers” — those with at least two full academic years’ worth of college.

The NSC researchers believe that potential completers should be at the center of the discussion about improving postsecondary completion rates. They say that policies still need to be tailored to fit their needs as older students returning to education after a period of extended absence from the system.

Most potential completers tend to be between 24 and 29 years old. Although women are slightly more represented overall in this group, men somewhat outnumber women within the 24-29 age bracket who have been out of the higher education system for two to six years. More than one in four potential completers enrolled continuously or intermittently for seven years or longer and their enrollment histories are equally split among two- and four-year institutions. These demographics, the researchers say, have unique needs that educators and policymakers need to address to bring these students back into schools and get them to graduation.

To learn more about the “some college group” including important policy recommendations, be sure to check out the full report.

Andrea Zimmermann, State Policy Associate

CTE Research Review

August 1st, 2014

Research Image_6.2013As terms such as “data-driven” dominate discussions of student educational outcomes, a new report shines a light on the challenges of data collection within the Career Technical Education (CTE) system.

Data collection is a key mandate of the Carl D. Perkins Career and Technical Education Act of 2006 as a means to hold state and local grantees accountable for achieving positive student outcomes, but grantees often face difficulty meeting these requirements due to a variety of external factors.

The report, titled, “Assessing the Education and Employment Outcomes of Career and Technical Education Students,” argues that additional guidance from the U.S. Department of Education and future legislation from Congress can help grantees generate valid, reliable and comparable state data. NASDCTEc’s Executive Director Kimberly Green authored the paper with Steve Klein, director of the Center for Career & Adult Education and Workforce Development at RTI International, and consultant Jay Pfeiffer.

The authors offer five recommendations for improving outcomes reporting:

  • Integrate CTE into state longitudinal data systems;
  • Promote state use of national data repositories;
  • Identify indicators of transition that promote federal policies;
  • Establish regulations governing placement; and
  • Provide states with reporting alternatives.

To learn more about data collection options, the challenges CTE grantees face in obtaining reliable data and more, be sure to check out the full report.

Andrea Zimmermann, State Policy Associate

College and Career Readiness in Context

August 1st, 2014

The College and Career Readiness and Success Center recently released a report that provides an important overview of every state’s college and career readiness definitions. It found that 37 states, including the District of Columbia, have defined college and career readiness; 15 states including Puerto Rico have none or are juggling multiple definitions.

While these definitions may “yield insight into state priorities and nationwide trends,” the report focuses exclusively on definitions, and does not examine the value and weight being given to college and career readiness within a state. In fact, when taking a closer look at a state’s public report cards and accountability systems, the story still appears to be college or career readiness with the focus of career readiness often being limited to a subset of students.

A recent report from NASDCTEc and Achieve titled, “Making Career Readiness Count,” found that although definitions abound for college and career readiness, only a few states are paving the way with comprehensive frameworks for public reporting and/or accountability formulas that encourages both college and career readiness.

Although 29 states publicly report at least one career-ready indicator, there could be a consequence – unintended or not – of siloing students and fields by developing a narrower approach to college- and career-ready indicators. A one-dimensional approach to college- and career-ready indicators could incentivize schools and districts to help students meet college or career ready benchmarks rather than a more comprehensive set.

When looking to improve existing public reporting and accountability systems, states should consider an expanded framework for college and career readiness indicators, thus ensuring that they are measuring whether all students are ready for both college and career, rather than just a subset of students.

Andrea Zimmermann, State Policy Associate

The Common Career Technical Core, Programs of Study & Industry-Based Standards

July 30th, 2014

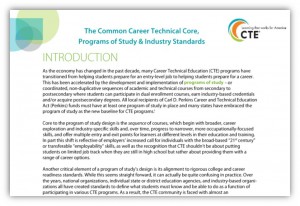
Yesterday, NASDCTEc released a new paper - The Common Career Technical Core, Programs of Study & Industry-Based Standards – during a webinar. Leveraging the methodology used to compare over 45 states’ CTE standards to the Common Career Technical Core (CCTC) last year for The State of Career Technical Education: An Analysis of State CTE Standards, this new paper examines how a set of 18 industry-based standards match up to the CCTC, with deep implications for state and local development of standards-based programs of study.

Critically, as we state in the paper, “The intent of this analysis is not to judge any industry-based standards…rather the intent is provide actionable information to state and local CTE leaders as think through how they use industry-based standards within the context of a program of study.”

What Did We Find?

For one, the industry-based standards, on average, were not particularly well aligned with the CCTC. However, this was largely as expected based on scope and design of the CCTC compared to most industry-based standards. The CCTC are benchmark standards that identify what a student should know and be able to do after completing a program of study. As “benchmark standards,” the CCTC are intentionally broad; as “end of program of study standards,” the CCTC cover the full range of knowledge and skills to be imparted over a sequence of courses, from the broadest career exploration to the more occupationally-specific skills. Alternatively, most industry-based standards focus squarely on those occupationally-specific skills, leading to a disconnect between them and the CCTC.

We also found that the majority of industry-based standards did not, on average, address the 12 Career Ready Practices, which are the cross-cutting skills and dispositions necessary for any individual in the workplace. Perhaps the most surprising finding was that less than half of the industry-based standards fully aligned to such Practices as “communicate clearly, effectively and with reason” and “work productively in teams while using cultural/global competence,” which are so highly demanded in today’s economy.

However, the analysis showed that many of the industry-based standards reviewed did align well with the Career Pathway-level standards, which are the most specific standards within the CCTC. Additionally, industry-based standards developed by consortia, such as the National Council for Agriculture Education and the Manufacturing Skill Standards Council, were much  more likely to address both the Career Cluster and Career Pathway-level standards.

What Are the Implications?

The bottom line is that industry-based standards play an important role in preparing students for careers, but that they cannot alone make up a program of study as they often fail to address the broader career exploration skills, as well as those key cross-cutting or “employability” skills that have utility in any career. As state leaders and other stakeholders develop, review and/or approve programs of study, they must:

  • Ensure the standards not only address the key occupationally-specific skills, but also those addressed at the Career Cluster level, as well as the Career Ready Practices, and
  • Provide guidance to local leaders and educators on how to implement the various sets of state and industry-based standards available and build out a coherent sequence of courses and learning experiences aligned to those different standards.

Read the full report here, watch the webinar recording or download the webinar PPT.

Kate Blosveren, Associate Executive Director, NASDCTEc

CTE Research Review

July 16th, 2014

Research Image_6.2013The National Association of State Budget Officers (NASBO) recently released a review of the state budget landscape for fiscal year (FY) 2015, which began on July 1. Career Technical Education (CTE) receives its funding through a variety of streams – including from these state budgets. While the report does not speak to CTE funding directly, understanding a state’s fiscal health is important, particularly after many continue to recover from the recession.

According to the governors’ proposed budgets, state spending is projected to grow moderately for the fifth consecutive year – to $750.1 billion, a 2.9 percent increase from FY 2014.  Though state revenues are projected to grow, gains are expected to be constrained by economic growth and a weak labor market, as they were in 2014. On average, states expected to see an estimated 5 percent increase in FY 2014, but in the end, only saw growth of 4.3 percent. While many states are expected to surpass pre-recession spending levels in FY 2015, 10 recommended states budgets remain below pre-recession highs.

Mid-year program cuts can be a clear sign of fiscal distress, according to the report. In FY 2014, nine states made mid-year cuts to K-12 and five made cuts to higher education. With modest fiscal advances for FY 2015, 39 governors have proposed increases to core services such as K-12 ($10.9 billion) and postsecondary education ($3.5 billion). Three states have proposed overall cuts to K-12 and five recommended slashing higher education funding.

Be sure to check out the full NASBO report for a state-by-state breakdown of changes to state aid, expenditures, revenues and much more.

Andrea Zimmermann, State Policy Associate

CTE Research Review

July 8th, 2014

Research Image_6.2013Science, technology, engineering and math (STEM) has been the focus of much research and discussion as a catalyst for innovation and economic growth.  With recent publications from the Brookings Institution and the National Center for Education Statistics, new research supports the idea that a STEM degree pays off – both in salary and rate of employment.

The Brookings report, “Still Searching: Job Vacancies and STEM Skills,” used labor market information to analyze the skill requirements and duration of online job postings, and found that job openings for STEM positions take an average of 50 days to fill – compared to the 33-day average for non-STEM jobs. In particular, advertisements for health science and information technology jobs within the STEM sphere were advertised 23 and 15 days longer, respectively, than non-STEM jobs, and professional STEM vacancies are staying vacant longer on average than before the recession. The study’s author suggests that these indicators show a short supply of STEM skills in the labor market despite clear demand, particularly in tech hubs such as Seattle, San Jose and San Francisco.

The report also pointed to an important variation that is often lost in data aggregation – STEM jobs requiring less than a bachelor’s degree were harder to fill than non-STEM jobs that required a bachelor’s degree. At the high school level, the hardest job to fill are STEM-intensive health care practitioners, such as medical and lab technicians, jobs that often pay in excess of $20/hour.

“These job openings data provide new evidence that, post-recession, STEM skills, particularly those associated with high levels of educational attainment, are in high demand among employers,” author Jonathan Rothwell wrote. “Meanwhile, job seekers possessing neither STEM knowledge nor higher education face extraordinary levels of competition for a scarce number of jobs.”

Another report, released this week from the National Center for Education Statistics, further supported the economic value of STEM skills through a four-year longitudinal study of baccalaureate graduates and their rates of employment.

As part of its ongoing “Baccalaureate and Beyond” data collection series, NCES surveyed a nationally representative sample of graduates who completed their bachelor’s degrees during the 2007-2008 school year. Of the 17,000-person sample, about 16 percent were STEM majors (including computer science, engineering, biological/physical sciences, math and agricultural sciences) and 83.8 percent were non-STEM majors.

In general, the data show that STEM degree-holders generally fared better than non-STEM degree holders in nearly every way including overall employment, number of jobs held since graduation, percentage of months spent unemployed, and average salary. Important to note, the NCES survey, unlike the Brookings report, classifies health sciences as a non-STEM degree, yet still STEM fares better overall. However, even with its NCES classification as a non-STEM degree, health sciences graduates still outperform their non-STEM peers in almost every category.

To learn more about how STEM fits into the CTE enterprise, check out our issue paper, “CTE is Your STEM Strategy”.

Andrea Zimmermann, State Policy Associate


Series

Archives

1