State Leaders Are Prioritizing Workforce Readiness but the Data to Get There Is Missing

May 22nd, 2019

Workforce readiness takes center stage in most education policy conversations these days. With last year’s reauthorization of the Carl D. Perkins Career and Technical Education Act of 2006 (now known as the Strengthening Career and Technical Education for the 21st Century Act or Perkins V), state leaders are increasingly focused on how they can improve and increase access to high-quality career technical education (CTE) programs. With more attention being paid to this important work, state leaders must be transparent about which kinds of CTE programs are being offered, who is accessing them, and how participants fare once they’re finished. To do this, states need to collect data that is meaningful and share it in ways that people can access and use to make informed decisions. Unfortunately, CTE data currently available leaves most students and families in the dark.

According to a recent report from Advance CTE in collaboration with partners including Data Quality Campaign (DQC), less than half of State CTE Directors say their CTE data systems provide the information needed to assist in making decisions about program quality and initiatives at both the secondary and postsecondary levels. The majority of states report being able to collect learner-level data on a variety of career readiness measures at the secondary level, but for a variety of reasons this information isn’t found on states’ most public-facing resource about school quality, their school report card.

In January 2019, DQC reviewed every state’s report card and found that only 21 states included the number or percentage of students who completed a CTE program or earned an industry credential. Almost no state reported a separate graduation rate for CTE concentrators. How states chose to report this information also varied greatly, making it difficult at times to understand and interpret the data. Some states reported CTE certification rates as a standalone indicator, while others rolled it into a broader college and career readiness (CCR) indicator. Combined CCR indicators are simple (in theory) but often contain a variety of very different data points (such as CTE certifications earned, dual enrollment, and AP course completion rates) and that summary indicator is rarely broken out to give readers a clear picture of the outcomes for each of the included, and very different, measures.

Two states, South Carolina and Pennsylvania, stood out for the variety of data each include about students’ pathways, which DQC highlighted as bright spots. South Carolina reports detailed CTE data, including course enrollment and completion, credential attainment, and the types of industry credentials earned by Career Cluster® (e.g., Business Management & Administration, Finance, etc.). Pennsylvania includes data about postsecondary pathways more broadly, such as military enlistment and postsecondary enrollment rates disaggregated by student group, as well as the percentage of students who have completed a work-based learning experience.

It’s certainly a positive step forward to see almost half of states beginning to include CTE data on their report cards, but more state leaders need to follow suit. By including CTE and career readiness data side-by-side with college-going rates, state leaders can help students and families see the value of CTE pathways. As states invest significant resources into further developing CTE programming, it is critical that they be transparent about program participation and student outcomes. In order for students to utilize these programs as paths to better outcomes, they must be equipped with the data needed to guide them there.

This is a guest blog post from Elizabeth Dabney, Director of Research and Policy Analysis at the Data Quality Campaign. The post was originally published here

Navigating the Stormy Waters of Career Readiness Data: New Report Highlights Opportunities for States to Improve their CTE Data Systems

April 18th, 2019

How many girls of color earned an industry-recognized credential in Information Technology last year? What types of work-based learning experiences lead to the best wage outcomes for learners from low-income families? How many graduates from Career Technical Education (CTE) programs in advanced manufacturing go on to work in their field of study?

A strong, well-aligned data system allows State CTE Directors and other state leaders to answer these questions and more. But according to the latest State of CTE report, The State of Career Technical Education: Improving Data Quality and Effectiveness, these data systems are not meeting the need for data-informed decision making.

While the report finds that 86 percent of State CTE Directors believe improving and enhancing their CTE data systems is a priority, only 45 percent say they have the information they need to assist in making decisions about CTE program quality and other initiatives at both the secondary and postsecondary levels. Making decisions about CTE program quality and equity without sufficient data is tantamount to sailors navigating the stormy seas using old maps and constellations rather than modern GPS technology.

What is the cause for this gap?

For one, state data systems are not sufficiently aligned across the secondary, postsecondary and workforce sectors. According to the survey, less than half of State Directors say their CTE data system is “mostly” or “fully” aligned with secondary data systems, 28 percent with postsecondary data systems and 18 percent with workforce data systems.

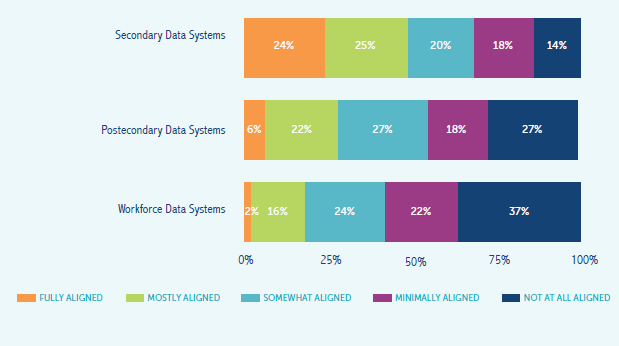
Ensuring learners are prepared with the skills and experiences they need for high-wage, high-skill employment in in-demand occupations is a shared responsibility among secondary education, postsecondary education and the workforce sector. Yet too many states continue to use disparate data systems for collecting, validating and accessing learner-level data. Using disparate systems not only increases the data collection burden for local leaders but also threatens the quality of the data and the ability of state leaders to use their data effectively.

Another critical challenge is improving the methods for collecting and validating learner-level data. Too many states rely on self-reported information without confirming that learners successfully completed a work-based learning experience, verifying that the industry-recognized credentials reported on school data submissions were awarded by credential providers, or documenting that learners earned postsecondary credit for completing dual or concurrent enrollment in high school.

Notably, 61 percent of states say they use student surveys – which have notoriously low response rates and are difficult to validate – to determine whether secondary learners go on to meaningful employment after they graduate. Thirty-three percent report the same for postsecondary learners.

This information is not easy to obtain and requires clear data sharing partnerships with employers, credential providers and other state agencies. But improving the methods of collecting and validating CTE data gives critical decision makers confidence in their use of data and ensures learners, educators and community members can trust decisions that are made on their behalf.

There are clear skies ahead, however, if states leverage implementation of the Strengthening Career and Technical Education for the 21st Century Act (Perkins V) to improve the quality and effectiveness of their career readiness data. Perkins V pushes states to improve data collection and reporting and make more data-informed decisions about CTE program quality and equity. As states begin the months-long process of vision setting, stakeholder engagement and plan development for Perkins V, they should consider the opportunity to improve their CTE data systems by auditing their current practices, establishing and formalizing data-sharing partnerships, and embedding data-informed decision making in policy and practice.

Equipped with strong, well-aligned data systems that are reinforced by trusted methods of collecting and validating data, State Directors can use their data to chart out a path to success for learners in their state. Otherwise the institutions, learners and communities they serve will be left unmoored.

The State of CTE report is based on a national survey of State Directors and examines how states are collecting, validating and using career readiness data. This resource was developed through the New Skills for Youth initiative, a partnership of the Council of Chief State School Officers, Advance CTE and Education Strategy Group, generously funded by JPMorgan Chase & Co. This resource was developed in partnership with the Workforce Data Quality Campaign, a project of the National Skills Coalition, and the Data Quality Campaign.

Austin Estes, Senior Policy Associate

The Number of States Counting Career Readiness Has More than Doubled Since 2014

March 19th, 2019

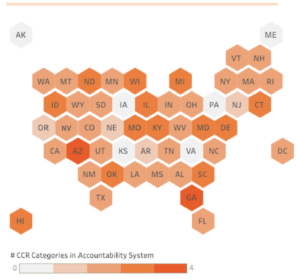
In a strong signal of support for Career Technical Education (CTE) and career readiness in high school, 40 states are now measuring career readiness in their state or federal high school accountability systems. Fewer than half as many – 17 – were measuring career readiness just five years ago.

The sophistication and design of the measures has evolved as well, and many states are working to intentionally link their accountability systems with high-quality career pathways.

That’s according to a new analysis from Advance CTE, Education Strategy Group, Achieve and the Council of Chief State School Officers. The report, the third edition in the Making Career Readiness Count series, uses a four-pronged framework that was developed by an expert workgroup and outlined in the report Destination Known: Valuing College AND Career Readiness in State Accountability Systems  to categorize how states are measuring college and career readiness.

The four categories used in the analysis provide a blueprint for states to develop and evolve rigorous measures. They each outline three levels that build upon one another, from Fundamental, to Advanced and Exceptional. The categories are:

  • Progress toward Post-High School Credential: Student demonstration of successful progress toward credentials of value beyond high school.
  • Co-curricular Learning and Leadership Experiences: Student completion of state-defined co-curricular experience(s) aligned to students’ academic and career plans.
  • Assessment of Readiness: Students scoring at the college- and career-ready level on assessment(s) that are validated by higher education and industry.
  • Transitions beyond High School: Successful student transition includes placement into postsecondary education, training or the workforce within 12 months of graduation.

Overall, the most common measure used across the states is Assessment of Readiness, with thirty states and the District of Columbia valuing experiences that are aligned with the Destination Known recommendations. Another 12 states include out of sequence measures that are aligned with this indicator but do not include the Fundamental measure, attainment of state-defined college- and career-ready level on a high school summative assessment. The vast majority of states counted under the Assessment of Readiness category are measuring industry-recognized credential attainment.

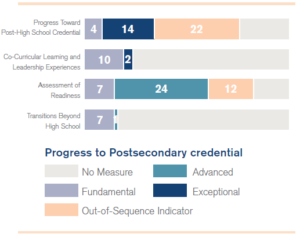
Another commonly used measure is Progress Toward Post-High School Credential. Seventeen states and the District of Columbia include measures aligned with the Destination Known recommendations, and another 22 states include out of sequence indicators. A number of states include either pathway completion or dual enrollment coursework in their accountability plans without requiring that experience to be accompanied by the completion of a state-defined college- and career-ready course of study, which is the Fundamental measurement in this category.

Twelve states include a Co-Curricular Learning and Leadership Experiences measure in their state or federal accountability systems, often looking at work-based learning participation. Eight states include information on Transitions Beyond High School, reporting either postsecondary enrollment or postsecondary enrollment without the need for remediation.

With all of the progress states have made, there is still room to strengthen and improve measures of career readiness. For example, states should be explicit about how career readiness components – such as work-based learning, industry-recognized credentials and dual enrollment – align to each other and to a students’ career pathways. They should also be transparent with their data and put thought and care into designing accountability systems that value and encourage the experiences that are best aligned with the outcomes they want for students. These and other opportunities are discussed in the report, Making Career Readiness Count 3.0.

The even harder work ahead is to support all students in their preparation for and transition to college, career and life. Regardless of the path students choose to pursue, they need to be transition ready. State and federal accountability systems can and should be used to highlight areas for improvement and connect programs and students with the supports they need to be successful.

Austin Estes, Senior Policy Associate

How to Prepare for the Future of Work

March 5th, 2019

Economists and futurists no longer ask what the future of work will look like, but rather when it will come and how disruptive it will be. Automation, artificial intelligence and other technological advancements are in the workplace today. Some say that innovations should be embraced and, like technological advancements in the past, the average American, and the economy as a whole, will be better off. Others issue dire warnings that automation and robotics will render many occupations obsolete and displace millions of American workers.

So which is it? The rose or the thorns?

The answer is, it’s complicated. According to the World Economic Forum, automation is expected to displace 75 million workers around the world by 2022. That’s a staggering sum — and in just four years. But the same report predicts that 133 million jobs will be created during the same period. What is almost certain is that, in the next few years, the world economy — and by extension, the American workforce — will experience a significant transformation as businesses adopt new technologies and American workers adapt and reskill to fill new jobs.

A new study out of the Boston University School of Law illuminates potential impacts of automation by examining survey data for non-financial private firms in the Netherlands. The researchers obtained data on automation expenditures for more than 36,000 firms over a 16 year period, from 2000 to 2016, in order to measure the effects of automation on employment and wages.

The researchers estimate that wages decreased for incumbent workers by about 8.2 percent over five years as a result of automation. However, recent hires experienced no wage loss and even earned 4.4 percent higher income over five years. It follows that the impact of automation will be more severe for older, more experienced workers, who at best will experience shifts in their day to day tasks and at worst will need to pursue further education, training and credentials to adapt.

For policymakers and economists, this begs the question: can anything be done to prepare for automation and new technology in the workplace?

The Brookings Institute recommends five actions to prepare for the future of work:

  • Embrace growth and technology, which will encourage firms to step up hiring and training new workers as the economy heats up;  
  • Promote a constant learning mindset by expanding traditional education, reducing the financial burden for skill attainment, and fostering employer-sponsored learning opportunities;
  • Facilitate a smoother adjustment by investing in career counseling, retraining opportunities and unemployment support for displaced workers;
  • Reduce hardships for workers who are struggling through the expansion of state and federal safety net programs;
  • Mitigate harsh local impacts by expanding support to vulnerable regions and communities that may be hardest hit.

Automation and artificial intelligence in the workplace will augment human skill and improve productivity. New technologies like autonomous vehicles and voice recognition will make it easier for all individuals — particularly individuals with disabilities — to access work and participate in civil society. But the future of work will likely bring with it disruption and displacement, and this burden will be disproportionately borne by workers in particular industries, occupations and geographic regions. Federal, state and local policymakers should consider clear strategies to prepare for the future of work. The time to act is now.

Research Roundup

Meanwhile, here is the latest roundup of research and data related to Career Technical Education (CTE):

  • There’s a racial gap in CTE enrollment. The National Center for Education Statistics reports that, according to high school transcript data, white students earned more (3.2) CTE credits on average than black (2.9), Hispanic (2.6), Asian (2.2) and mixed race (2.9) students.
  • The American Association of Community Colleges developed an infographic based on a recent Pew Research Center study that depicts the different post-high school plans of today’s teens. One notable takeaway: 12 percent of teens plan to attend a two-year college and 4 percent plan to attend a technical or vocational school after high school. 
  • Skills training is pretty popular with American voters. According to polling from ALG Research, with support from the National Skills Coalition, 93 percent of likely 2020 voters support increasing investments in skills and technical training.
  • It’s not just you — CTE is getting more popular. The American Enterprise Institute looked at media mentions of CTE between 2012 and 2018 and found that the number of articles mentioning CTE has increased by more than a hundredfold in that time.

Austin Estes, Senior Policy Associate

Work-based Learning is Predictive of Future Job Quality, According to New Study

December 10th, 2018

The Brookings Institution looks at employment outcomes for low-income learners

It’s a question that has puzzled education researchers for decades: what is the right mix of experiences in early adolescence that is most predictive of future career success and lifelong learning?

For the longest time, the rule of thumb has been “get a bachelor’s degree and you’ll get a good job.” But we know that there are other experiences on the path to a four-year degree (such as participating in work-based learning or earning an industry-recognized credential) that are just as powerful in preparing learners for their future careers. What are these experiences? And how should they be delivered to maximize learner outcomes?

New research from the Brookings Institution sheds a little bit of light on this question. The study looks at different factors that are correlated with economic success among 29-year-olds from “disadvantaged” backgrounds. The study finds that:

  • Participating in work-based learning is correlated with attainment of “high-quality” jobs later in life
  • Working (and earning high wages) at a young age predicts higher job quality in adulthood
  • Earning credentials is still the biggest predictor of career success, but sub-baccalaureate credentials are also important

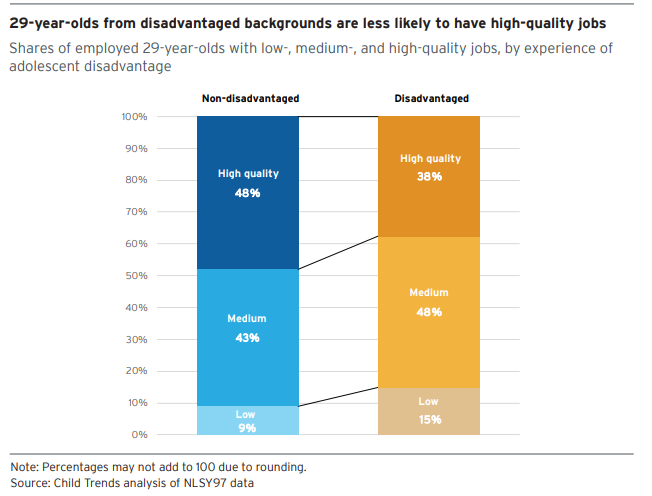
Specifically, the researchers find that participating in “relationship-focused CTE” (a term they use to refer to work-based learning and other activities where students interact with industry mentors) is significantly related to higher job quality scores at age 29. This would seem to suggest that building relationships with industry mentors and completing work-based learning at an early age can help learners, particularly low-income learners, get a leg up on their careers. While the data do not provide a full picture of the quality of work-based learning in the study, the evidence is promising.

For the purpose of the study, the researchers define “disadvantaged adolescents” as those who, when they were between the ages of 12 and 18, had a family income equal to or less than 200 percent of the federal poverty line; did not have a parent with more than a high school education; had a mother who was a teenager when her first child was born; or whose family received public assistance. They defined job quality based on four factors: earnings, benefits, hours of work and job satisfaction.

CTE Research Roundup

  • In a new research brief, MDRC summarizes findings from studies of three different career-focused learning programs: New York City’s Young Adult Internship Program (YAIP), YouthBuild and Year Up. Using a random assignment research design, the researchers find significant positive wage increases for completers of each program.
  • JFF explores how the scope and length of Registered Apprenticeships can vary and poses the question: Are apprenticeships the next stackable credential?
  • The NewDeal Forum Working Group, a national network of state and local leaders, published recommendations for policymakers to help the economy adapt to the future of work. The report includes recommendations for skill development and workforce training; modernizing the social safety net; and supporting entrepreneurship, innovation and access.  
  • Mathematica Policy Research shares an update on new partnerships and research focused on pathways to postsecondary education, including an examination of free tuition programs for adult learners, a study of the Better Careers initiative in California, and research into community college career planning through the Working Student Success Network. Keep an eye out for future research.
  • A new study from JFF looks at Maine’s proficiency-based education system and finds some promising early results. According to the study, high school students who received a medium amount of exposure to proficiency-based education had significantly higher reported engagement; however, exposure to proficiency-based education was negatively correlated with SAT scores.

Austin Estes, Senior Policy Associate

Free College: A Brief Policy History

September 24th, 2018

Advance CTE will be writing a series of blog posts profiling the policies and practices of free college in the United States. This post will explore the history of the movement toward free college. Check back for blogs on the challenges, successful practices and future of free college.

College affordability, or lack of affordability, is one of the most pressing problem in the world of higher education. Free postsecondary education has long been a topic of conversation, and various models have been piloted at the state and local levels. The Atlantic’s “Debt Free” article explains that this idea was given renewed national attention when former President Barack Obama addressed the topic in his 2015 State of the Union speech. In particular, President Obama advocated that the place to start implementing such policies was in community colleges. Afterward, with the upcoming presidential election campaigns underway, the conversation of free college remained part of many candidates dialogue. Senator Bernie Sanders (I-VT), for example, was a vocal advocate.

Some state higher education institutions previously held free college policies, but found that model unsustainable over time. TIME’s piece, “What Happened When American States Tried Providing Tuition-Free College,” profiled some such examples:

  • For decades, the University of Florida was free for in-state students to attend. Around 1959, “registration and instructional fees” began to be instated and in 1969 full tuition was imposed;
  • The City University of New York system did not have tuition fees for students until 1976; and  
  • When the University of California (UC) system was started in 1868, free admission and tuition for in-state students was ensured. The California State and community-college systems decided the same. However, in 1960, California’s Master Plan for Higher Education allowed for students to be charged certain fees. In 1970, students were charged an “educational fee,” which has increased over time.. From that point on, California continuously decreased the amount of funding towards high education. In 2004-2005, UC allocated only 16 percent of funding to higher education compared to 32 percent in 1974.  

A main driver behind institutions pulling back on free college practices has to do with the significant increase in enrollment, as reported by the National Bureau of Economic Research. Whereas in the 1909-1910 school year only 355,000 of Americans 19-24 years old (2.9 percent of those in that age bracket) enrolled in higher education, by 2012 that number increased to 31.4 million (41 percent). At the same time, state and local funding for public colleges and universities decreased. Just from 2008-2016, overall state dollar allocation across the country to institutions of higher education has declined by 16 percent. If free college policies were put in place at the founding of an institution, the combination of increased enrollment and decreased state and local funding made the model unsustainable.

Meredith Hills, Policy Associate

Joint Paper Promoting Collaboration in STEM Education Released

August 28th, 2018

All too often, policy conversations concerning science, technology, engineering and math (STEM) happen separately from conversations related to Career Technical Education (CTE). Recently, Advance CTE partnered with the Association of State Supervisors of Mathematics, Council of State Science Supervisors, and International Technology and Engineering Educators Association to release STEM4: The Power of Collaboration for Change to highlight the importance of collaborating and coordinating strategically in these areas.

The document notes that, despite an abundance of initiatives and efforts, our nation is not achieving its goals in preparing students for college majors or careers in STEM and offers three main principles to drive and implement outstanding STEM education research and practices:

Principle 1: STEM education should advance the learning of each individual STEM discipline.

Principle 2: STEM education should provide logical and authentic connections between and across the individual STEM disciplines.

Principle 3: STEM education should serve as a bridge to STEM careers.

Each principle is accompanied by a set of recommended actions that may be taken to shift toward access to and equity in STEM preparedness that is felt to be crucial.

The paper is the product of an organized and coordinated effort among the leadership of our respective organizations to address the challenges faced when implementing STEM education and providing access to the knowledge, skills, and career pathways necessary for all students, particularly those in underserved populations.

To read the document, click here.

Ashleigh McFadden, State Policy Manager

New Research Sheds Light on the Value of Credentials, Dual Credit and Apprenticeships

August 23rd, 2018

It is common knowledge that earning a postsecondary credential, particularly in a high-skill, high-wage, in-demand industry, can help learners land good jobs. But how do learners get there? New research sheds light on the different pathways learners take to get to a good job and the economic returns of credential attainment.

$224 million a year. That’s how much more money the most recent cohort of graduates from Tennessee public colleges and universities can expect to make every year compared to non-credential holders. That figure comes from a new report published by the Tennessee Department of Economic and Community Development in June. The report attributes much of the wage gains to the impact of community and technical colleges across Tennessee.

While a postsecondary credential pays a premium for graduates, many learners work through college. In fact, according to a new brief from the National Center for Education Statistics, 32 percent of students at public 2-year colleges worked full-time while enrolled in the 2011-12 school year. The study also finds that students were more likely to complete a degree if they worked 20 hours or less a week compared to students who worked full time or did not work at all. The study did not say whether or not these students were working in fields related to their program of study, however.

Learners can start working on their postsecondary credential even before they graduate high school. New research from the University of Texas system shows just how much of an impact dual enrollment has for Texas students. According to the study, dual credit students had higher college graduation rates and higher GPAs than their peers. And students who entered the University of Texas system with credits from both Advanced Placement and dual credit classes were five times as likely as their peers to graduate in four years.

Yet learners often do not complete their credential at their initial institution. According to the National Student Clearinghouse Research Center, 38 percent – or 1,069,243 students – in the fall 2011 cohort transferred within six years. The study also revealed this startling statistic: only 5.6 percent of transfers from two-year colleges leave with a certificate or associate degree.

Postsecondary credentials reinforce the technical and academic skills learners will exercise in their future careers. But employers often look for candidates with a more rounded skill set that can only be learned through experience. A new survey from Bloomberg Next finds that 43 percent of employers say new recruits lack the soft skills to be effective, skills like teamwork, critical thinking and adaptability.

One way to build these skills is through work-based learning experiences like internships and apprenticeships. Adults in the U.S. are increasingly recognizing the value of apprenticeships. The American Staffing Association reports that 94 percent of Americans say that apprenticeships are helpful in leading to a new career and 62 percent even think apprenticeships make people more employable than going to college.

At any rate, learners have multiple pathways to lifelong career success – be it through an apprenticeship, a two-year college or a four-year university – and should be empowered to choose the path that is right for them.

Austin Estes, Senior Policy Associate

Making the Most of Outcomes-based Funding: Aligning Postsecondary Funding with Labor Market Needs

August 14th, 2018

One of the smartest investments state policymakers can make is in postsecondary education. As the economy moves towards more specialized, technology-based industries, learners will need education and training beyond high school to fill the jobs of tomorrow. Today, the ticket to the middle class, and the key ingredient for a thriving state economy, is a strong system of higher education.

Yet, this system is not as efficient as it could be. Three out of every four students who enroll in a public, two-year college do not graduate with a degree or certificate within three years. Whether due to financial or family circumstances, lack of clarity about future career goals, or poor academic preparation, too many students are getting saddled with debt and nothing to show for it.

In recent years states have led renewed efforts to improve student outcomes by restructuring postsecondary funding formulas. This approach, known as performance-based or outcomes-based funding, aims to align state dollars with outcomes that support learner success and economic growth, including progress toward and attainment of a postsecondary credential.

As of Fiscal Year 2016, 30 states were either implementing or developing outcomes-based funding formulas for postsecondary education, though two-year institutions were included in the funding formula in only 22 states. While the widespread enthusiasm for accountability and alignment in higher education funding is remarkable, states vary considerably in their degree of commitment. According to HCM strategies, which published a national scan of outcomes-based funding formulas, only four states (OH, NV, ND and TN) in FY2016 distributed more than 20 percent of state funds to postsecondary institutions based on outcomes.

In 2017, the State Higher Education Executive Officers Association (SHEEO) reported that a little more than half of the revenues for postsecondary institutions came from state appropriations (the remaining funding came from local appropriations (6.4 percent) and tuition revenues (43.3 percent)). This gives state policymakers a powerful lever to incentivize change in institutions of higher education.

And, while evidence in support of outcomes-based funding is mixed, positive results have been documented in states with more sophisticated funding systems:

  • After enacting a new funding formula in 2014-15, the Wisconsin Technical College System documented a 5 percentage point increase in graduates employed in jobs related to their field of study and a 7 percent increase in the number of degrees awarded.  
  • In Tennessee, after the state enacted a new funding formula in 2011, researchers noted a significant impact on the likelihood of graduating with an associate degree in three years,  completing certifications, and accumulating 12 and 24 credits.
  • After the Washington State Board for Community and Technical Colleges enacted the Student Achievement Initiative, researchers documented an increase in the number of short-term certificates issued, though attainment of associate degrees remained flat.

Many states have learned from these lessons and either modified existing or adopted new outcomes-based funding formulas to apply best practices. Arkansas is one such state. In 2016, the state legislature passed HB1209, directing the Higher Education Coordinating Board to design a productivity-based funding formula for state colleges and universities. The formula, which will be used to determine how the Higher Education Coordinating Board distributes general revenue for two-year and four-year institutions,  includes three dimensions:

  • Effectiveness (weighted at 80 percent): measures credential attainment, progression, transfer and gateway course success.
  • Affordability (20 percent): measures time to degree and credits at completion.
  • Adjustments and efficiency (+/- 2 percent): includes adjustments for rural schools, research-based institutions, etc.

What is notable about Arkansas’ approach is the use of best practices to incentivize credentials with labor market value and encourage equitable access.

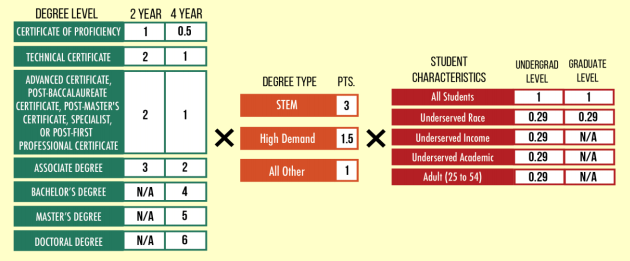
The points an institution receives in the formula for credential attainment are multiplied if the credentials are in Science, Technology, Engineering and Mathematics (STEM) or state-defined “high-demand” fields. Qualifying fields are designated by the the Arkansas Department of Higher Education and the Department of Workforce Services. The multiplier for STEM degrees is 3 points; the multiplier for degrees in high-demand fields is 1.5 points.

The formula also includes adjustments for historically underserved students by race, income, age and academic proficiency. For certain elements of the formula — such as credential attainment or progression — the point value is increase by 29 percent for each student meeting these criteria.

While it is too early to tell the impact of these changes, Arkansas’ productivity index aims to improve postsecondary outcomes by aligning state funding with labor market needs and encouraging institutions to support historically underserved populations.

Austin Estes, Senior Policy Associate

Advance CTE Releases Report on Postsecondary CTE Program Quality

August 1st, 2018

With the majority of “good jobs” that pay a family-sustaining wage requiring at least some college education — such as a technical certificate, associate degree, bachelor’s degree or another credential of value — ensuring the existence of high-quality postsecondary Career Technical Education (CTE) programs and pathways is more important than ever before in preparing learners for high-skill, high-wage and high-demand careers.  

Although postsecondary programs are typically considered to be the purview of individual institutions, supported by academic freedom and local control, states have an important role to play in ensuring that each learner has access to only high-quality and relevant programs, notably by leveraging program approval and program evaluation policies and processes. Today, Advance CTE released Driving Quality in Postsecondary CTE: Approval and Evaluation Policies, a report that explores how states are leveraging this role to ensure quality.

Without question, states and postsecondary systems and institutions face unique challenges and opportunities in the quest to ensure program quality and relevance. These challenges include a variety of governance and delivery models, state and federal requirements, and multiple layers of program approval through regional and occupation-specific accreditors. At the same time, states, systems and institutions have meaningful opportunities to support and fund those programs that are best serving learners and their communities’ workforce needs.

Advance CTE’s report also explores a few specific state examples:

  • In Wisconsin, the Technical College System (WTCS) uses its statutory authority to review and approve all postsecondary programs in two phases: concept, where the system office and then the State Board review program foundations, including labor market justification, and program, where the system office and State Board review program curriculum. WTCS also suspends as many associate degree programs as it approves, so that programs that no longer have labor market relevance and/or quality outcomes are phased out and newer programs with higher quality and more relevance are adequately supported.
  • The California Community Colleges system is the largest system of higher education in the nation, with 114 colleges serving 2.1 million students. In 2004 the Chancellor’s Office developed what is now called the California Community Colleges Curriculum Committee (CCCCC) to coordinate efforts between local and statewide curriculum processes and work on program and course approval and evaluation. Through the CCCCC, the state has been working to delegate some of the responsibility of program approval and evaluation to individual institutions, but with policy guidance from a thorough and robust handbook. In this way, the system is working to reduce the burden on colleges while still maintaining quality of programs.
  • The Florida College System (FCS) and State Board of Education (SBOE) work together to ease the burden of program approval processes by designing and validating curriculum frameworks at the state level. These frameworks involve input from numerous industry partners and content experts and list key standards and benchmarks that programs must meet. Once a curriculum framework has been approved by the SBOE, other FCS institutions may apply the framework to new programs and are not required to undergo an approval process. Most FCS institutions start programs by using an existing framework, allowing them to start their program more quickly and avoid a lengthy approval process.

Check out Advance CTE’s report to learn more about ensuring quality in postsecondary CTE programs.

Ashleigh McFadden, State Policy Manager


Series

Archives

1